How to determine the different zones in the field for the purposes of variable fertilization?
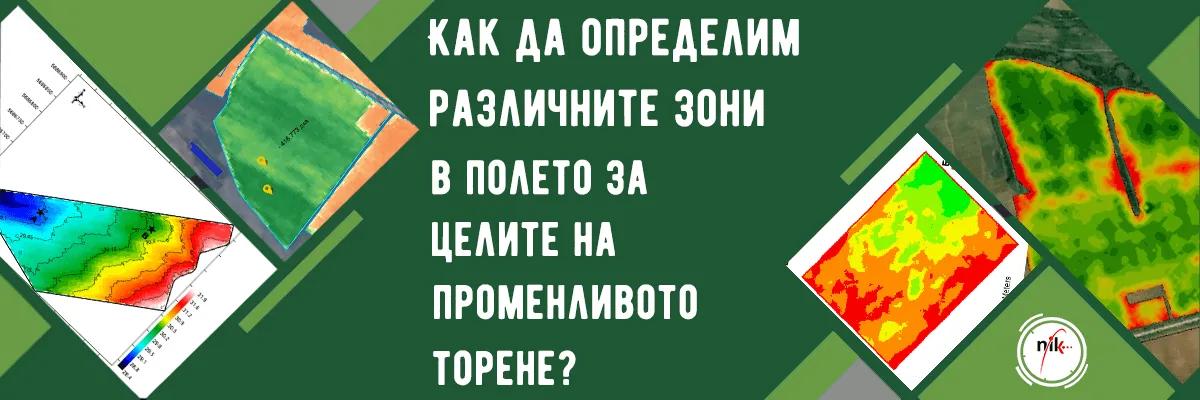
The essence of Variable Rate Application (VRA) technology is to apply different fertilizer rates to different areas.
The application of the right amount of fertilizer only where necessary is made on the basis of real-time measurements, usually of the chlorophyll content of the plants or on a predefined field map. These maps are drawn up based on information from various sources.
The purpose of applying a variable fertilization rate is to optimize fertilization costs and obtain better and higher yields.
How to determine the different zones in the field for the purposes of variable fertilization?
The development of prescriptions for variable fertilization is a complex process.
This requires the analysis and processing of information from various sources.
To better understand the variability of the soil in a farm, different types of maps and also direct observations on the fields can be used.
There are different approaches to developing prescriptions for variable fertilization, and each has advantages and limitations. Here are some of them:
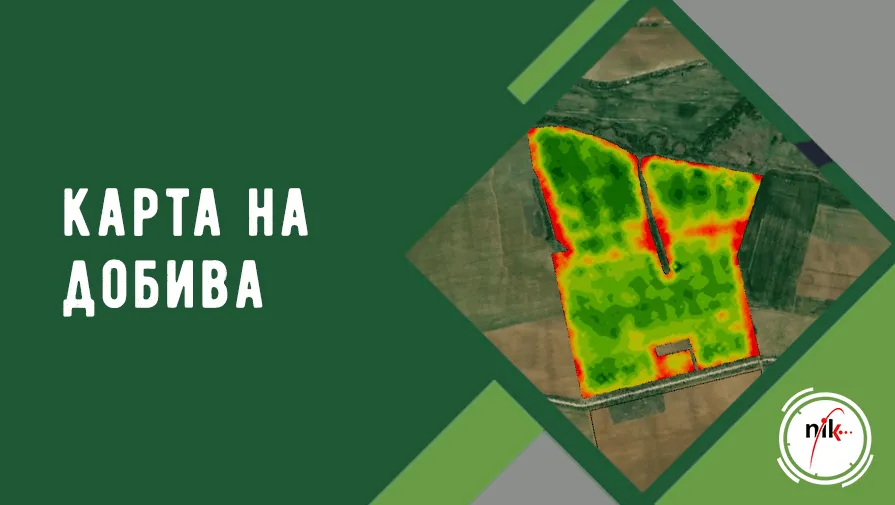
Mining Maps
They can be generated when yield and geographic location data are recorded at harvest from the combine. Yield maps are very useful for identifying areas of high, medium and low yield potential. The challenge here is to highlight the main factors contributing to higher or lower yield potential.
Unfortunately, different areas in yield are not necessarily clearly related to differences in soil type and soil fertility. In addition, yield maps often vary greatly over the years, which further makes it difficult to determine the different zones.
Salination Maps
If the presence of salinity is a potential problem on the farm, it can be used to develop a map using various sensors or laboratory analyzes. In this situation, fertilization rates can be reduced, depending on salinization levels. Thus, they will correspond to the lower yield potential. Having a good salinity map is a useful tool if it is a problem on the farm.
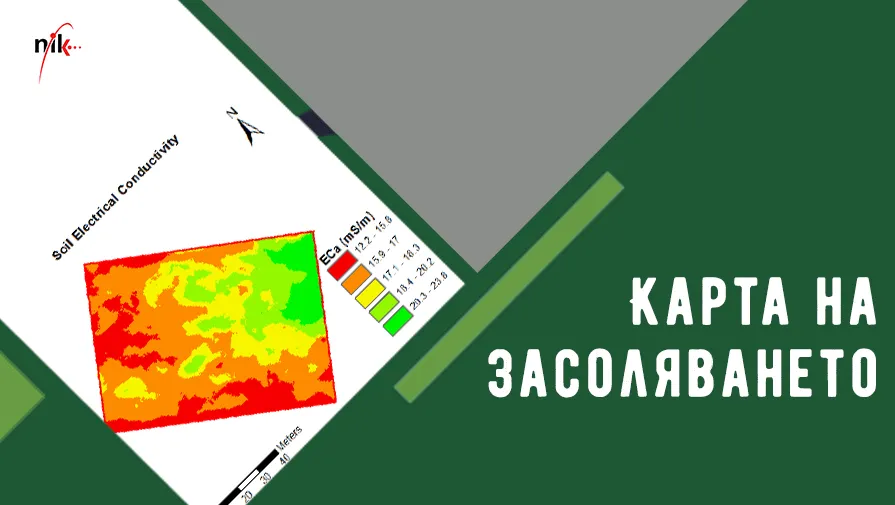
Photo source: doi.org
Soil Mechanical Composition Maps
It is generally accepted that soils with a higher clay content have a greater capacity to hold water and nutrients, and therefore have a greater potential for yield. These maps can also be drawn through sensors or laboratory analyzes. Soil mechanical composition maps generated using sensors take into account the electrical conductivity of the soil. The measurements are based on the fact that soils with a higher clay content are better conductors than those that contain more sand. However, the readings are also higher on wetter soils, and when the salt content is higher. Sensors cannot distinguish the causes of higher or lower readings.
Humus content and soil reaction maps
In addition to mechanical composition, some sensors can also map other soil properties, such as pH and organic matter. As with the rest of the results obtained from sensors, too often they diverge from those obtained from laboratory analyzes. For this reason, they need additional validation tests.
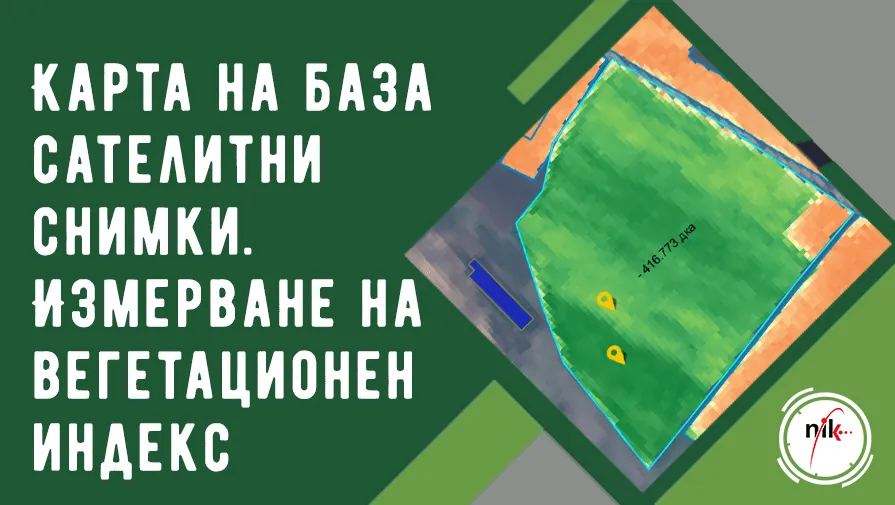
Maps based on satellite images.Vegetation index measurement
Maps can help identify higher and lower productive areas of the field.
Satellite images are used to assess plant development. Areas with higher values are assumed to have higher mining potential.
Image information can change significantly during a growing season and often varies greatly from year to year. This complicates the interpretation of the information from the images.
For this reason, images should be used in conjunction with other methods to identify areas of consistently higher or lower productivity. Satellite imagery has similar limitations as the use of crop yield maps. The main factors that contribute to differences in crop biomass in a field should be identified.
It is important to understand whether differences in biomass are related to differences in soil fertility or if there are other factors that influence.
Topographic maps
These maps can be very useful for developing prescriptions for variable fertilization. Relief is a major soil-forming factor that has a strong influence on the presence of soil differences. In order to draw up such a map, it is necessary to collect GPS information, which is usually done at the same time as mapping the yield at harvest time. Various programs have been developed that are suitable for the purpose.
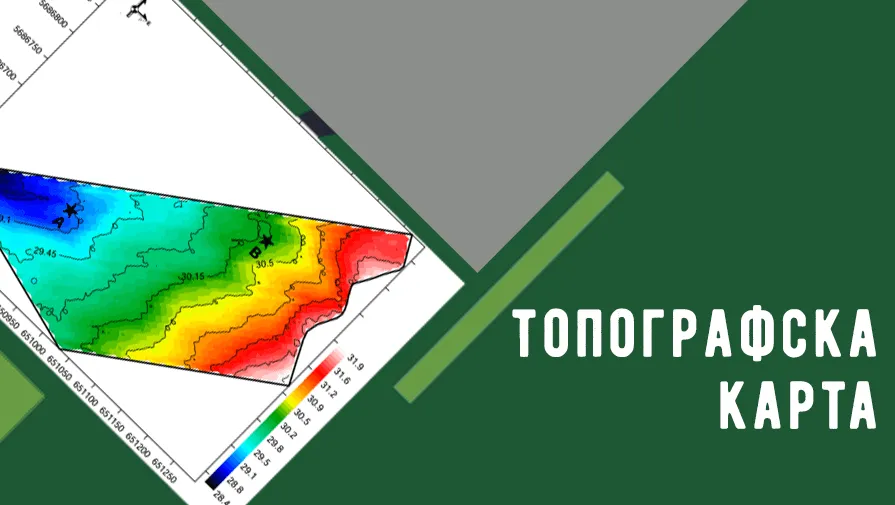
Photo source: doi.org
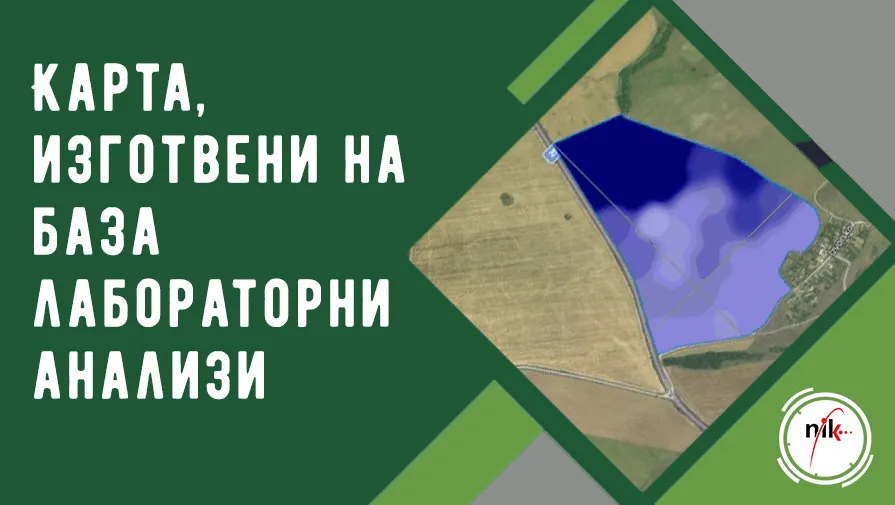
Maps prepared on the basis of laboratory analysis
In contrast to the use of sensors, the maps prepared on the basis of laboratory analysis are used to quantify the nutrient stock of the soil, as well as all other physico-chemical characteristics of the soil.
This makes them much more reliable in the process of drawing up prescriptions for variable fertilization.
Such maps are also an integral part of the integrated agronomic service AgroBalance.
All of the listed types of cards carry information that has its advantages and limitations. The multitude of data generated can lead to confusion, especially if the information is contradictory. This is the time when it is best to turn to experts with many years of experience in analyzing and interpreting this type of information, as well as in drawing up prescriptions for variable fertilization.
Contact the team of specialists of NIK Agro Service or write to us by email:
Other articles
.webp)