NICK VLOG: How do we map the yield at sunflower harvest?
In the new episode of NIK Vlog we tell you about mapping the yield in sunflower harvest — what is it, is it worth it, how to do it, how effective is it?
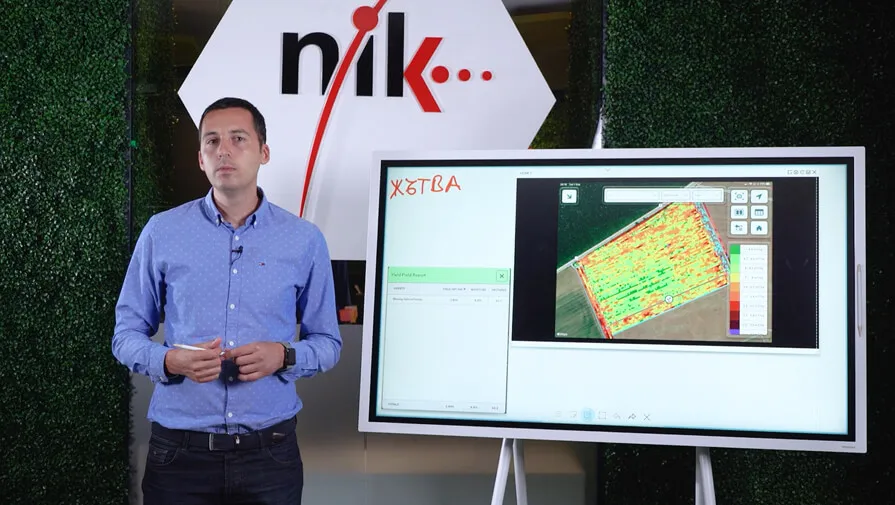
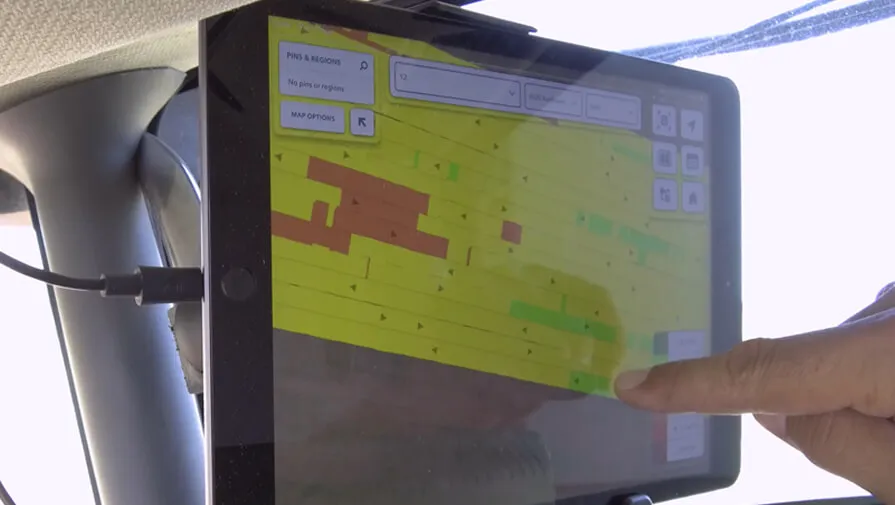
To do this, let's look at an example field. From the photo it is clearly seen that the average yield is 280 kg at 8.8% moisture. But when we look more closely at the map, we see that there are areas with over 400 kg of yield per acre. At the same time, there are also sections that have a much lower yield. These zones significantly lower the average yield for the entire field.
How do we get this information and in what way can we map the yield with the equipment of Precision Planting, will tell us Ilker Judaim from NIK.
How to plot the yield when harvesting sunflower?
The system we use to map the yield is YieldSense, the work of Precision Planting. It is mounted on a CLAAS LEXION 540 harvester, and today we will see how it works in a field of about 700 decares when harvesting sunflower.
Precision Planting's American YieldSense system has been on the market for about 5-6 years. It has been tested in Bulgaria for the second year in a row. Initially, tests were done in the field at wheat harvest, and we are currently testing its functionality during sunflower harvest as well.
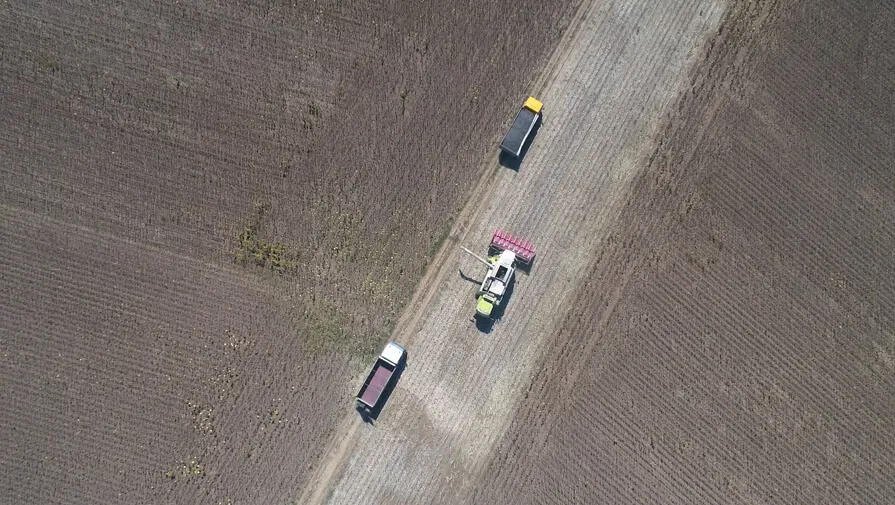
But let's see how the combine carts the yield.
“At the moment, two sensors are installed on the combine, one of which is for measuring moisture. And the other is a kinetic sensor for measuring instantaneous yield. The moisture sensor takes into account the current moisture in the field so that it is easiest to judge how good the harvest conditions are. On the other hand, the kinetic sensor, which is placed on the grain auger, takes into account the instantaneous yield,” Ilker explained.
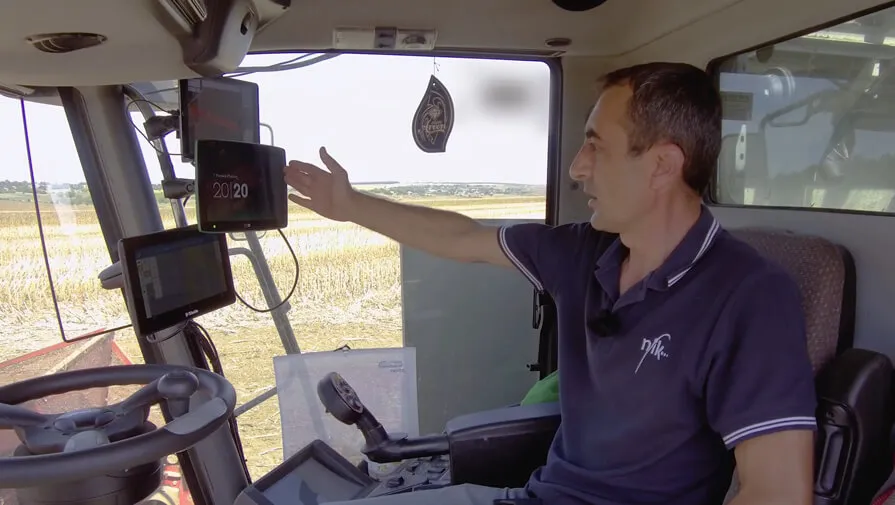
In the cabin of the combine
“In the harvester, we have a 20|20 display of Precision Planting, which reports the instantaneous yield at harvest. Separately, we have a tablet that, via the Internet, sends the data to the cloud. From there, they can be immediately seen from another device — tablet, phone, computer with Internet access. We also have a control system installed Trimble Autopilot™ Motor Drivewith steering wheel motor plus displayTrimble GFX 750with 2 cm accuracy.
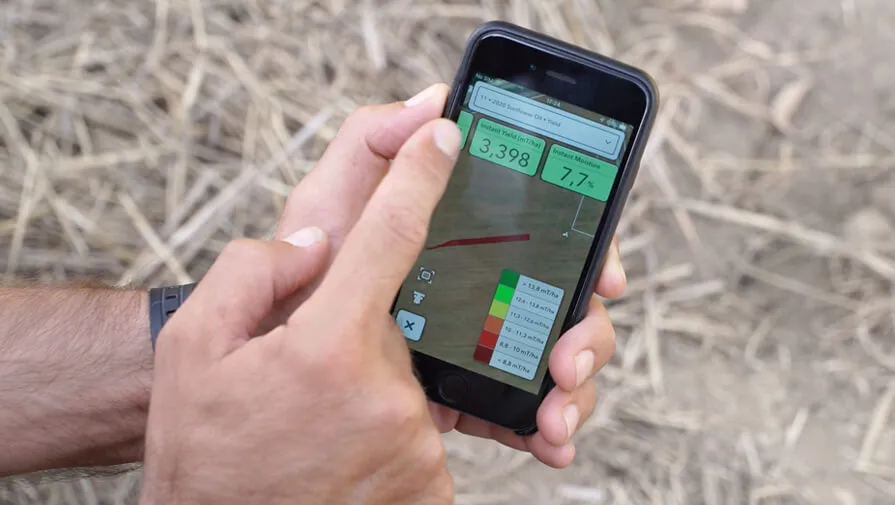
We use autopilot in the rows, 20|20 display of Precision Plantingtogether with the tablet we use to map the yield,” Ilker Yudaim said.
This is what the different areas of the field look like. It is clearly visible where, what is the yield. Green areas are the places of high yield. Reds are low-yielding, and yellow ones have average yield values.
“We are currently observing records of sowing data that come from the same Precision Planting system. This data, at the time of sowing, was uploaded and stored in the cloud automatically. And now we can clearly compare them with the harvest.
We see the areas that came from the planter in the spring, with gaps, seed doublings, applied pressure and how this subsequently affects the harvest itself can be clearly seen. The direction of the sowing itself and of the harvest is also clearly visible. With these two maps, the analysis of data from farmers is already at a new level - much more data for much more informed management decisions,” concluded Ilker Yudaim.
If you want to receive more interesting and useful information, subscribe to the NIK channel atYoutubeas well as our specialemail newsletter!
Other articles
.webp)